The incident#
Recently, a colleague told me one of their applications intermittently throws exceptions saying the connection was reset. The application sends HTTP requests to multiple service providers but the error only happens to a specific one.
The error (from a .NET app) looks like:
System.Net.Http.HttpRequestException: An error occurred while sending the request.
 ---> System.IO.IOException: Unable to read data from the transport connection: Connection reset by peer.
 ---> System.Net.Sockets.SocketException (104): Connection reset by peer
   at System.Net.Sockets.Socket.AwaitableSocketAsyncEventArgs.CreateException(SocketError error, Boolean forAsyncThrow)
   at System.Net.Sockets.Socket.AwaitableSocketAsyncEventArgs.ReceiveAsync(Socket socket, CancellationToken cancellationToken)
   ...(omitted)
Well, at this point, all we know is this application sent an HTTP request and got rejected because the other end, the third-party service provider, probably sent an RST packet and the request then failed.
Preliminary hypothesis#
Fortunately, we have dealt with similar issues before.
Normally, there will be several load balancers/reverse proxies between the client and the servers doing the real work. And each one of them keeps a persistent connection between itself and the adjacent ones.
The cases we encountered a while back happened to point 3️⃣. Even though the ingress controller holds the persistent connection to the upstream servers, they have different idle timeout settings. One of our services is a Node.js server in which Keep-Alive timeout defaults to only 5 seconds, whereas the ingress-nginx has 60 seconds.
When the connection is not being used for a while, say, 7 seconds, the upstream servers close it unilaterally. Then a new request came to the ingress controller, the ingress controller tried to reuse the idle connection since the connection was considered reusable because the “timeout” hadn’t expired based on its setting.
However, the upstream received the request and thought it shouldn’t have happened, therefore rejected with an RST packet. The ingress controller received the packet and said the connection was reset by the peer (a.k.a. the upstream server). The ingress controller then responded with an HTTP 502 to the load balancer, and the load balancer continued to respond with HTTP 502 to the client.
So, what does this story have anything to do with the one we are talking about here?
The incident we dealt with before happened to 3️⃣.
We suspect the problem we are facing here is identical, but happened to 1️⃣ instead, where our client has the idle timeout set too long, and/or the other end set timeout too short.
What’s HTTP Keep-Alive?#
In HTTP/1.0, connections are not persistent by default. However, this changed with HTTP/1.1 according to RFC 2616:
8.1.2 Overall Operation
A significant difference between HTTP/1.1 and earlier versions of HTTP is that persistent connections are the default behavior of any HTTP connection. That is, unless otherwise indicated, the client SHOULD assume that the server will maintain a persistent connection, even after error responses from the server.
Persistent connections provide a mechanism by which a client and a server can signal the close of a TCP connection. This signaling takes place using the Connection header field (section 14.10). Once a close has been signaled, the client MUST NOT send any more requests on that connection.
There are a lot of useful resources about Connection and Keep-Alive headers like MDN, I will only put a high-level concepts here. Basically:
- Persistent connection using Keep-Alive is on by default with HTTP/1.1, but not HTTP/1.0.
- On HTTP/1.1, you don’t need to set the
ConnectionandKeep-Aliveheader to make it work. Keep-Aliveheader relies onConnection: Keep-Aliveto be effective. TheKeep-Alivedefines the timeout and the max pipelined requests can be sent with the connection. But still, it’s legit if you don’t set this header.- To explicitly disable this behavior (even on HTTP/1.1), set
Connection: close. This can be sent on the client or server side. - When the timeout expires, one side doesn’t (and can’t) proactively inform another side about the close of connection. The
Connection: closeheader has to be sent along with a request or response. - This is a very different mechanism than the persistence connection defined in HTTP/2.
Looking for the evidence#
Even though the exception said the connection was reset by the peer – how do we know if it’s real? Well, I personally believed it though. But still, we need to speak with evidence.
This application runs on an EKS cluster and we decided to just use tool like tcpdump to see what happened behind the scenes.
There are many ways and aspects to check the network packets for a container – you can use tools like kubeshark, ksniff, or good old tcpdump. You can either record the packets on the worker node level or record on the very same network namespace that the pod is using – it’s totally up to you.
In this case, we just wanted to see what the application saw from its perspective – so we jumped into the container and simply installed a tcpdump in it since the image was based on a Debian-variant .NET core runtime image. If it’s based on images like distroless or any image without shell and higher privilege, you can also use ephemeral containers (which wasn’t available to us at the point).
First, install tcpdump:
$ kubectl exec -it <POD_NAME> -- bash
/# apt update; apt-install -y tcpdump
Execute tcpdump on eth0 and output to a temporary location:
/# tcpdump -i eth0 -w /tmp/20230920.dump
Grab a coffee and check if the problem shows up (which was pretty frequent in this case). Then, say thanks to tcpdump and copy the file to local for further troubleshooting:
/tmp $ kubectl cp <POD_NAME>:/tmp/20230920.dump .
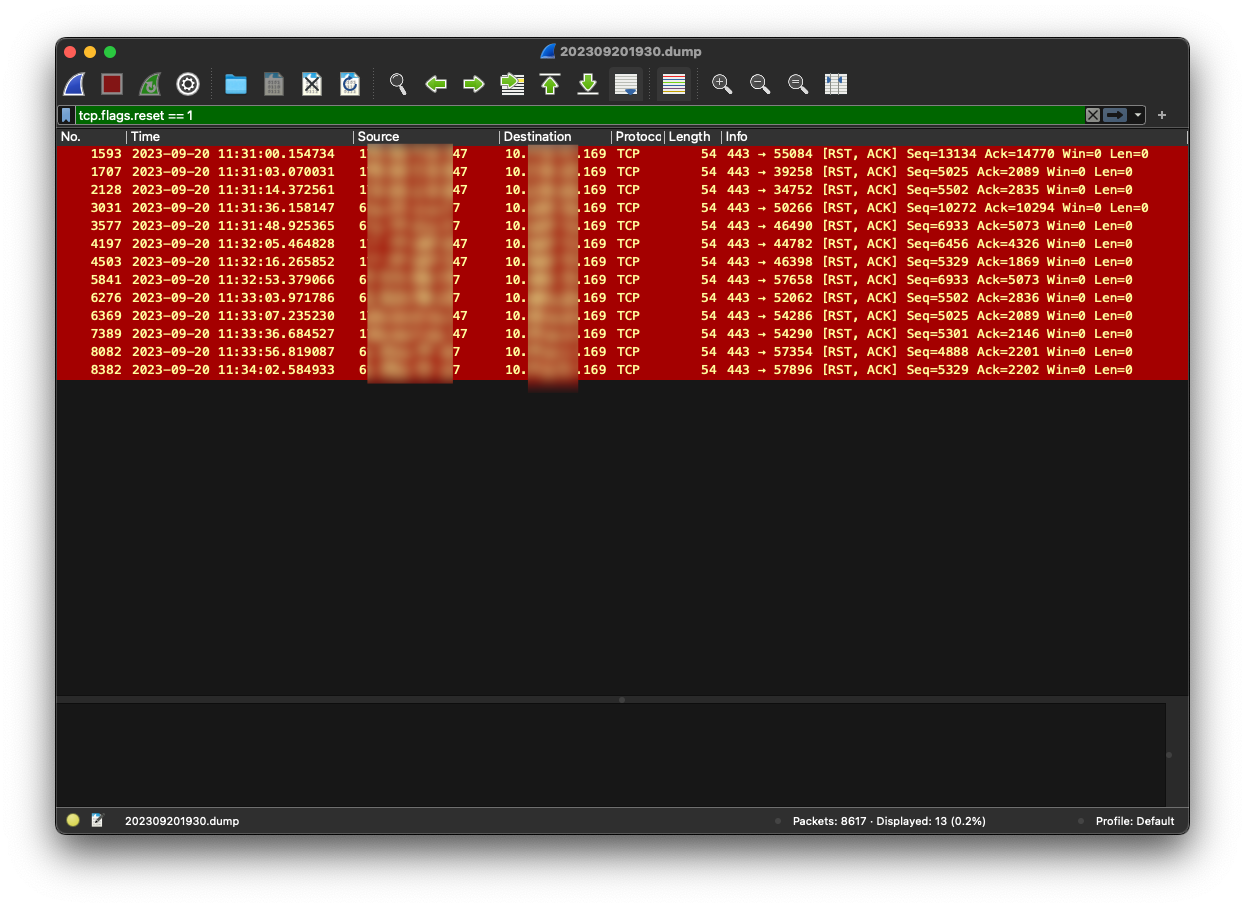
So, what do we have here? By entering tcp.flags.reset == 1 in Wireshark, you can see there were indeed a few frames with RST packets.
In Wireshark, each conversation has a stream index, which consists of source IP, source port, destination IP, destination port, and protocol.
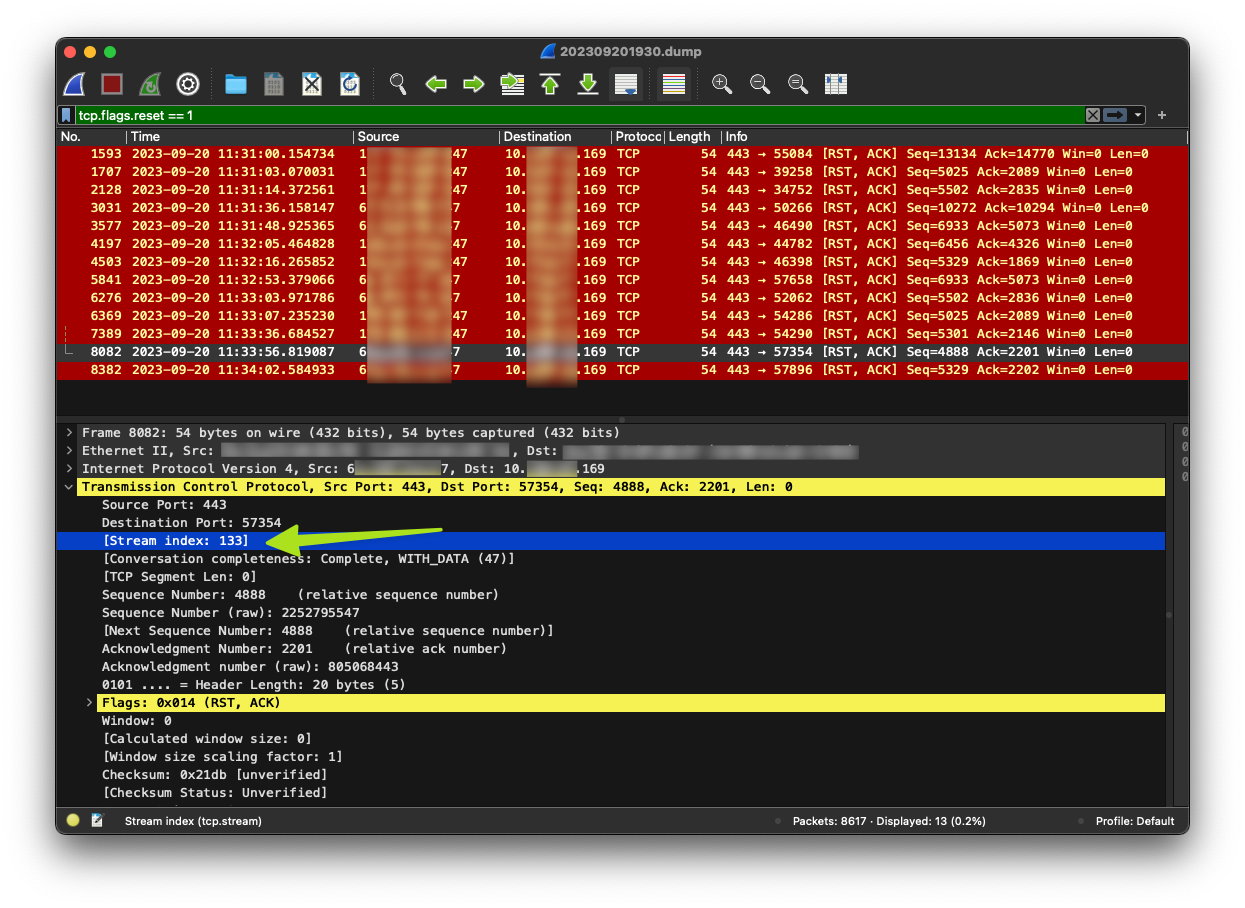
We can choose one of the frames above and follow the conversation by their stream index, let’s just use stream index 133 here:
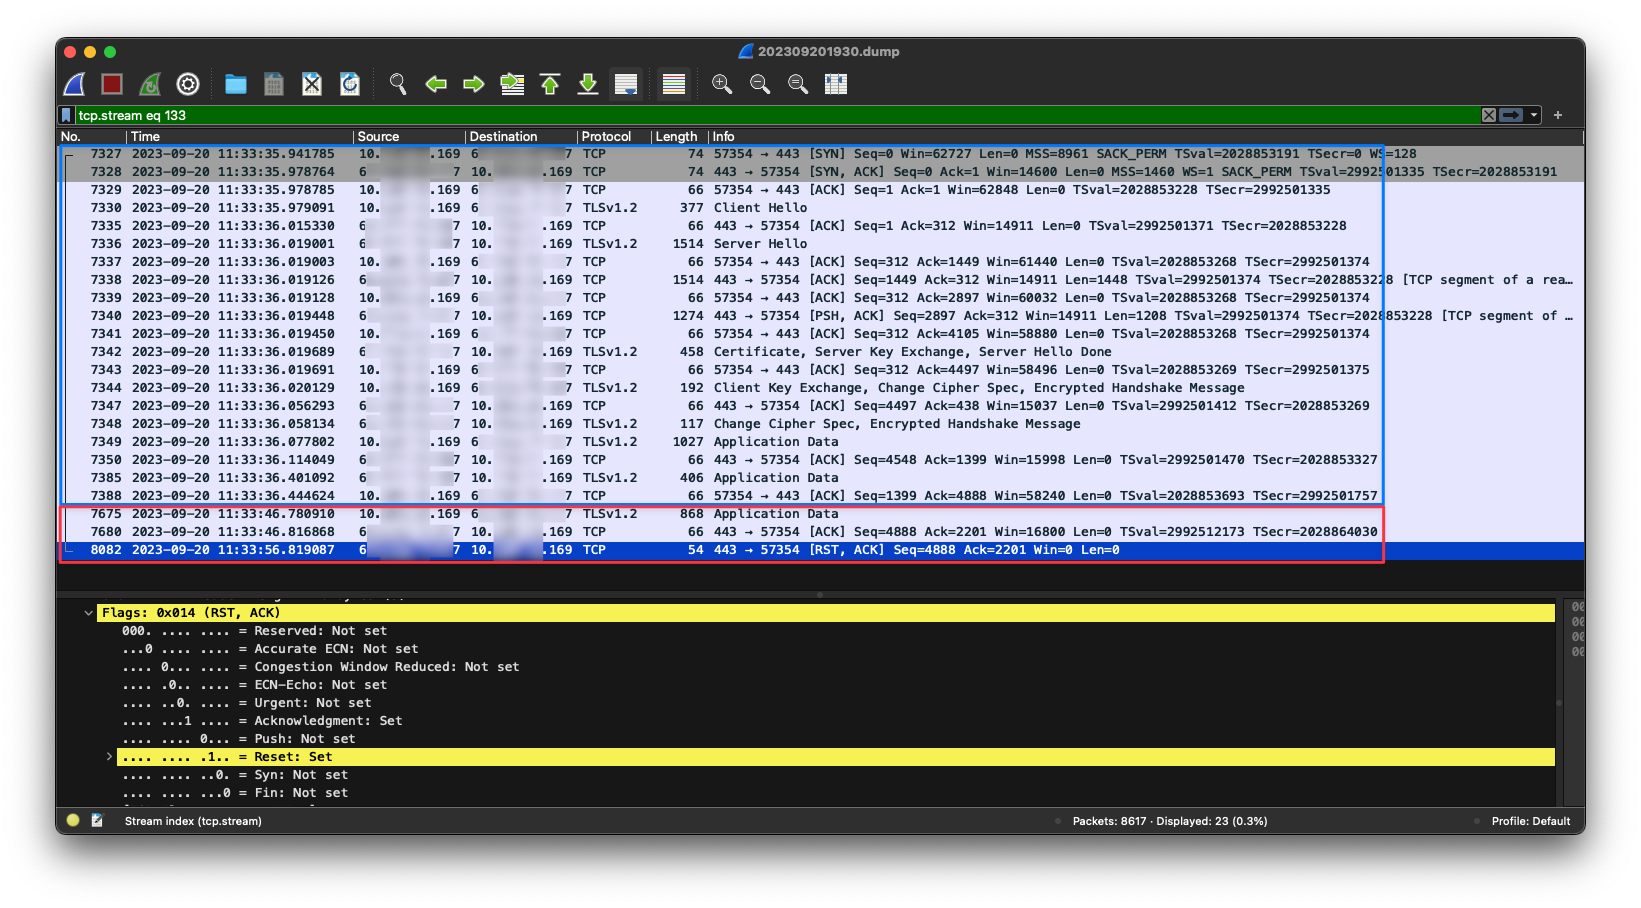
From the image above, we learned that it’s encrypted with TLSv1.2 (given it’s an API with HTTPS protocol), it seemed not to have too much information, but it’s enough here.
In the blue square, we can see the connection was properly established and successfully sent the “Application Data” (can’t see it because of the encryption) to the server and received their response as “Application Data” as well. The whole request was complete (without closing the connection because of Keep-Alive) and seemed nice and sound.
However, 10 seconds later, in the first frame of the red box, we saw that the client at our end decided to send another request with its “Application Data” to the server again, and the server actually ACKed it.
Weirdly enough, the server didn’t reject the request immediately. Instead, it waited for another 10 seconds before responding with the RST, ACK packet, and that time matched the log of the application saying the connection was reset.
Digging further#
Since I don’t have the source code of this app, and I couldn’t simply find out from the tcpdump result, there were still a few questions remaining:
What HTTP version did the server support?#
See if the server still supports HTTP/1.1:
$ curl --http1.1 -vvv -X POST "https://some_domain/some_path" # redacted for security, of course
* ALPN: offers http/1.1
# ...(omitted)
* using HTTP/1.x
> POST /some_path HTTP/1.1
# ...(omitted)
< HTTP/1.1 200
< Date: Sat, 20 Sep 2023 12:50:11 GMT
< Transfer-Encoding: chunked
See if the server still supports HTTP/1.0:
$ curl --http1.0 -vvv -X POST "https://some_domain/some_path" # redacted for security, of course
* ALPN: offers http/1.0
# ...(omitted)
* using HTTP/1.x
> POST /some_path HTTP/1.0
# ...(omitted)
< HTTP/1.1 200
< Date: Sat, 20 Sep 2023 12:50:00 GMT
< Connection: close
Apparently the server supports both HTTP/1.0 & HTTP/1.1. However, with HTTP/1.0 (even though responded with version 1.1), the server responded with the header Connection: close. With the HTTP version set to 1.1, the server didn’t explicitly send Connection and Keep-Alive header.
Remember the concepts above? HTTP Keep-Alive only works on HTTP/1.0 and HTTP/1.1 and is the default behavior on the latter.
If both client and server didn’t send Connection: close on HTTP/1.1 request, the connection is persistent for…who knows how long.
Did the server close the connection explicitly?#
Only on HTTP/1.0 requests. But I really can’t guarantee the client app is using HTTP/1.1.
Did the server support HTTP Keep-Alive and was using it?#
Yes, when specified with HTTP/1.1. They don’t explicitly close the connection.
Any chance they were communicating with HTTP/2?#
$ curl --http2 -vvv -X POST "https://some_domain/some_path" # redacted for security, of course
* ALPN: offers h2,http/1.1
# ...(omitted)
* using HTTP/1.x
> POST /some_path HTTP/1.1
# ...(omitted)
< HTTP/1.1 200
< Date: Sat, 20 Sep 2023 14:26:02 GMT
It seemed they support h2, but still communicated with 1.1.
Why is it HTTP Keep-Alive? Why can’t it be TCP keepalive?#
TCP keepalive is very different than HTTP Keep-Alive. TCP keepalive will periodically send a packet to the destination. You can see the example here. However, I am not sure what it looked like when capturing over a TLS connection.
The solution#
Anyway, the hypothesis seems possible. It’s highly likely caused by the different HTTP Keep-Alive idle timeout on both ends.
If everything is controlled by us, I would say the further right the component is in the architecture, the higher the Keep-Alive timeout value it requires.
However, since it’s an external service, I suggested maybe temporarily disabling the Keep-Alive setting in his HTTP client to this very service provider and see if it helps.
Long story short, it does help. So the next step is to find out how many seconds should we set at our end. I was told it’s 120 seconds by default on their client, which is a bit high in my opinion.
I then asked the colleague, did the service provider say anything about their timeout setting?
He said they did ask the service provider – but the answer was just way too confusing to write it down here.