- 2023/07/09: Added the query-scheduler, table manager, and compactor.
Our logging solution for Kubernetes cluster has been CloudWatch Logs for a long time, and we were ok with it. For applications with spcial requirements, we leveraged S3 for long-term, low-cost storage, then query with Athena.
However, as more and more services being containerized and moved into Kubernetes cluster, issues start to emerge:
The time from ingestion to ready for search is suboptimal. Take CloudWatch Insights as an example, it takes roughly 2 minutes to find the logs from my experience.
Searching logs at different places is inconvenient and slow for service team members, let alone comparing them.
CloudWatch Logs cost is going to increase significantly. We can put it into S3, but there will be no metric filters.
Colleagues from very different tech stacks need a lot of time to learn different things.
“Problems solved” is not enough#
So I started to search for other feasible solutions. It’s not difficult to solve the problems above. There are solutions from Datadog, Splunk, and don’t forget the classic EFK stack.
I checked a few choices then stopped at Grafana Loki (hence this post). I heard this before but haven’t really looked into it. There are always too many new things going on, especially in the cloud native world. I think we can all agree that tools come and go. What’s important is the values they can provide.
After comparing the solutions a bit, I think Loki can solve our problems like other solutions, plus:
Grafana becomes an one-stop-shop#
We are already using the Prometheus with Grafana stack for metrics monitoring; Loki will perfectly fit. Team members know how to use PromQL for metrics, and LogQL uses a similar concept. They will have a lower cognitive load when working on logs. Besides, they can figure things out quickly now that they don’t need to navigate between different places.
Logging is a critical part of our observability journey, along with the traces in the future (yeah, we are late to the party). So the experience and efficiency here are important.
It can store data in S3 (and others, of course)#
This significantly lowers the cost for us. One thing I laughed so hard when watching the Getting started with logging and Grafana Loki session is that most of the logs are really “write once, read never”.
Yes, data storage costs for just lying there, but only $0.025 per GB in ap-northeast-1. Let’s assume there is a self-hosted Elasticsearch cluster as an example; a single cheapest EBS (sc1, somehow impractical in this case) costs $0.018 per GB-month, and you won’t just have one instance hanging around, let alone the cost of of these machines running all night.
Object store is much more cost-effective here, and you get the high availability and durability.
Better yet, we still get to transform logs into metrics.
Concepts#
Logs, labels, streams, and chunks#
 |
| source: Getting started with logging and Grafana Loki |
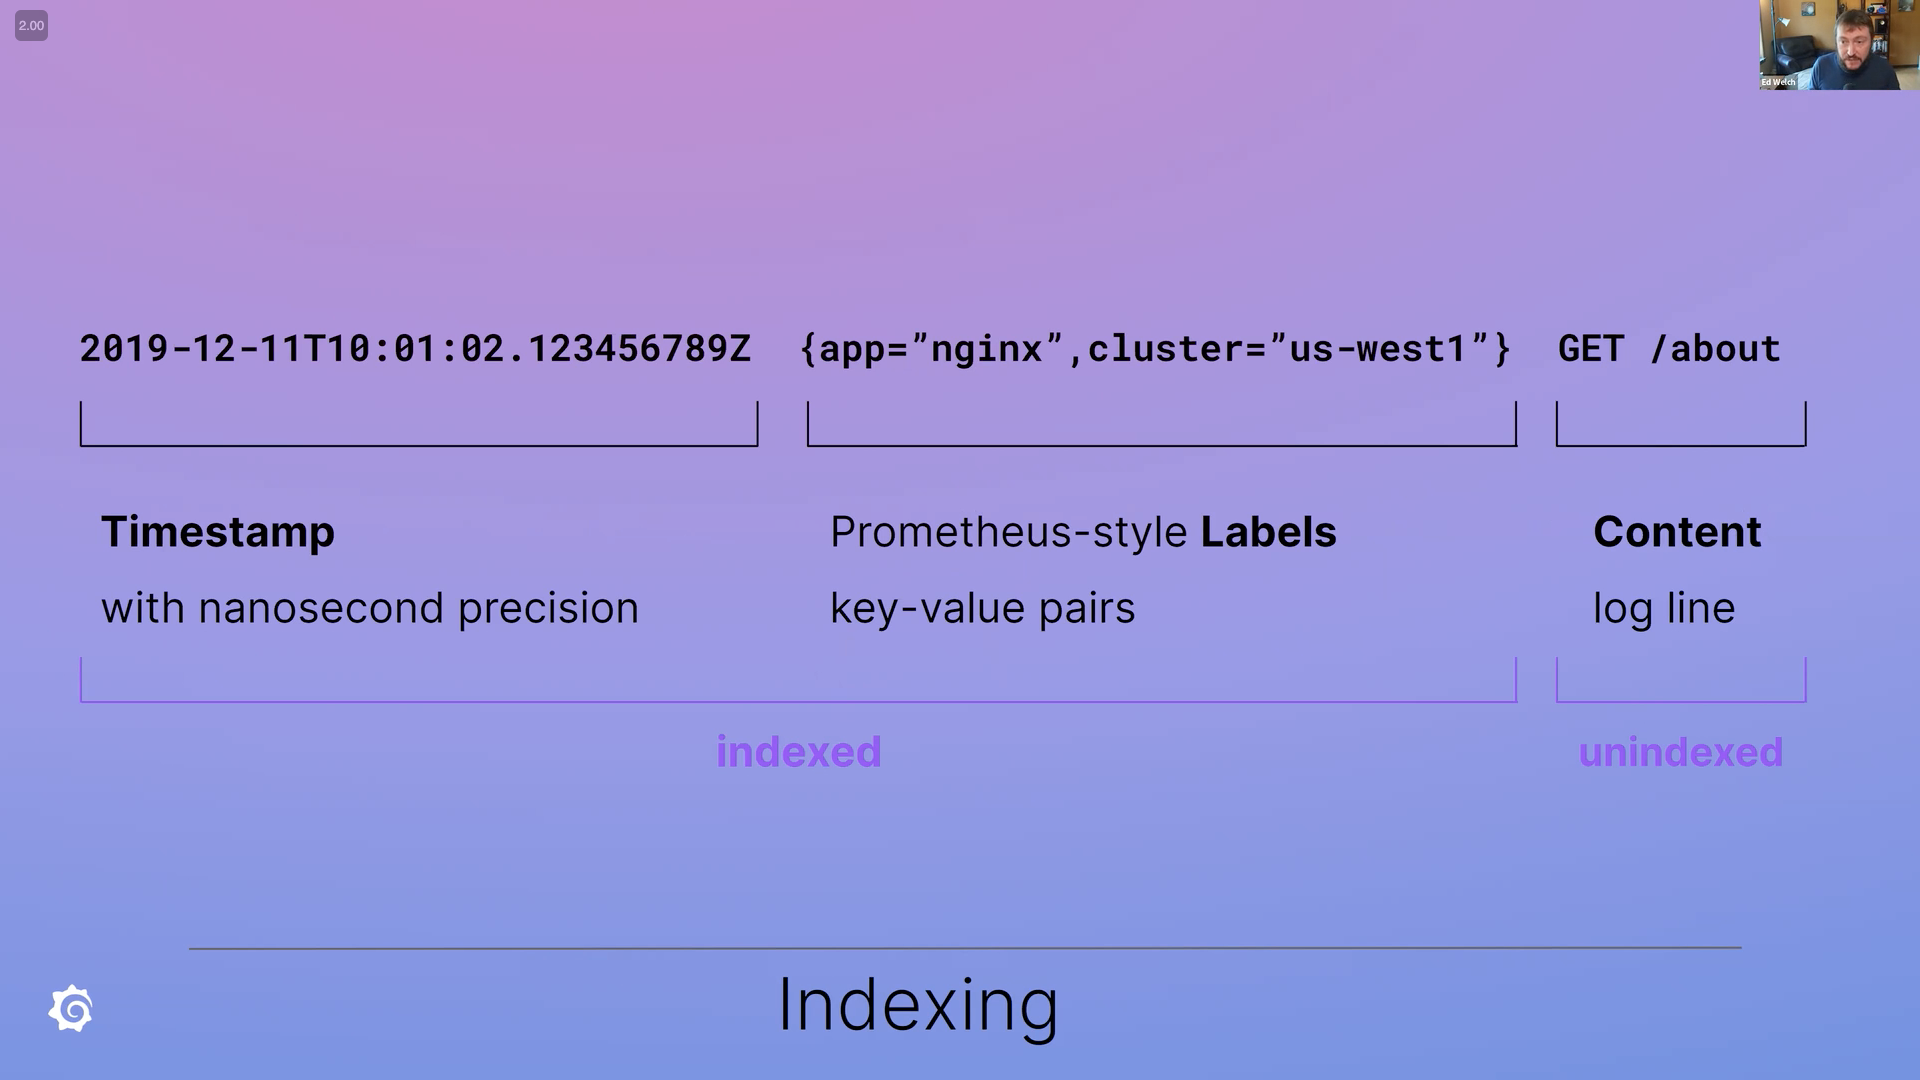
A Log sent to Loki will be treated as two parts:
metadata
data (well, the log itself)
Metadata consists of timestamp and the label set. The usage of labels is similar to Prometheus Labels, and it’s critical for both writing and reading.
When a log arrives, Loki hashes the tenant ID and the label set to calculate which stream it belongs to.
Logs of a specific stream are batched and stored as chunks. Loki is only efficient for large chunks.
The following label sets will be sorted and are considered as the same stream (given the same tenant):
{cluster="us-central-00", namespace="loki-1", container="ingester"}
{cluster="us-central-00", container="ingester", namespace="loki-1"}
However, the following are two separate steams (again, given the same tenant):
{cluster="us-central-00", namespace="loki-1", container="ingester"}
{cluster="us-central-01", namespace="loki-1", container="ingester"}
To quote the official document:
High cardinality causes Loki to build a huge index (read: $$$$) and to flush thousands of tiny chunks to the object store (read: slow). Loki currently performs very poorly in this configuration and will be the least cost-effective and least fun to run and use.
See Cardinality for more details. A few rules of thumb about labels:
Labels should not be extracted from Logs. Unless streams generate throughput more than, say, ~3MB/s, then it makes sense to split into smaller streams.
- Getting started with logging and Grafana Loki mentioned GCP load balancer logs as an example.
Too many labels make indices too big, which means slow. This sounds counterintuitive, but it’s the small indices that makes Loki fast.
If you are not sure what to put in a label set, stick to the topology. It should just tell where the logs come from. For example:
{cluster="us-central-00", namespace="loki-1", container="ingester"}. However, if it’s a supermassive Kubernetes cluster, you probably need to think twice before using container name.Keep total unique streams per 24 hours less than 200,000 per tenant.
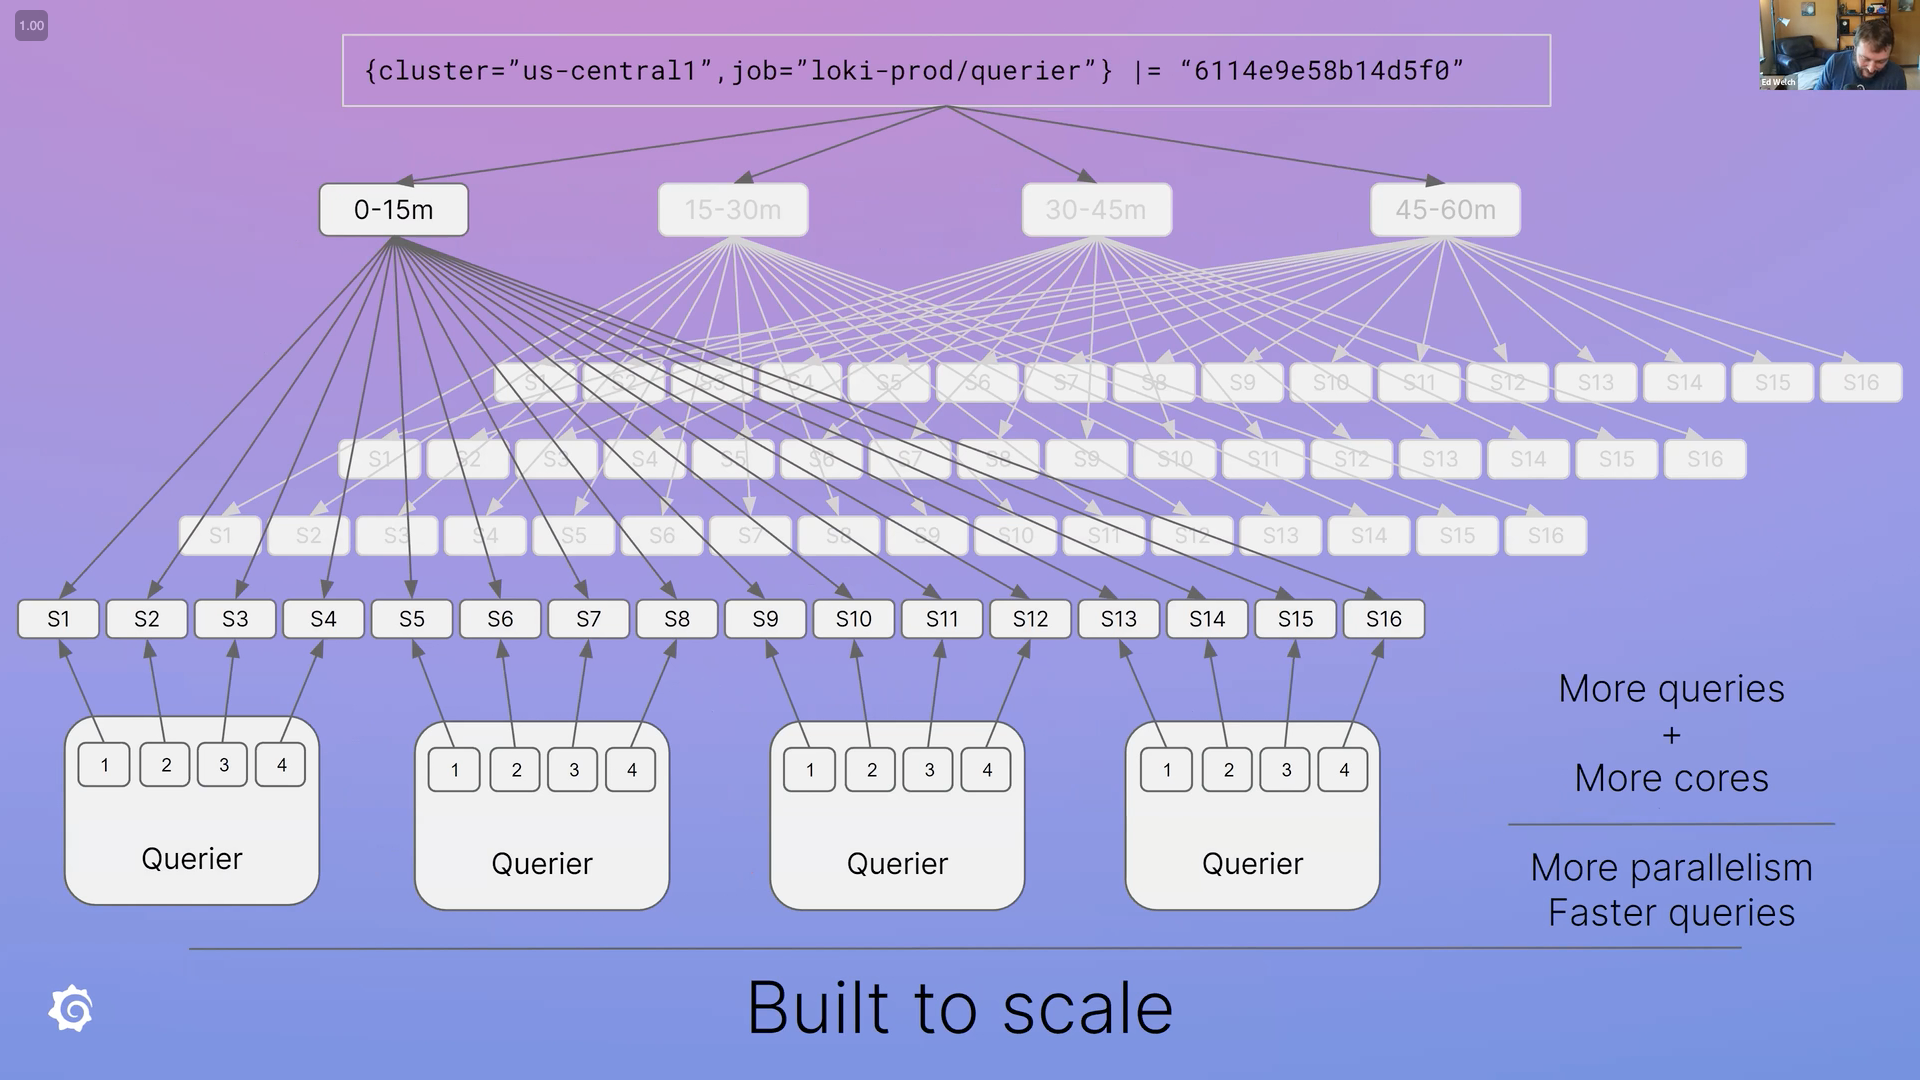
Loki, unlike the heavily-indexed solutions, only indexes metadata. With the “label rules” above, You might ask: how does it get fast? It turns out, Loki has to load all chunks that match labels and search window by breaking the “big query” into much smaller ones for queriers (querier is explained below) to run in parallel, and finally put them together.
Its brute way of fetching logs is different than other solutions in exchange for low cost. And you still get to decide the query power.
It’s incredible how this mechanism pulls off and how powerful cloud providers’ object storage is nowadays.
 |
| source: Getting started with logging and Grafana Loki |
Write path: distributor and ingester#
The write path is the journey of how logs are ingested into your storage. There are two components involved: distributor and ingester.
Distributor#
When a distributor receives a log request, it has several jobs to do:
Validating the data for things like whether labels are valid, the timestamp is not too new or too old (out-of-orders are enabled by default), and log lines are too long.
Normalizing (sorting) the labels. Same label set with different label order is identical like the examples mentioned above:
{cluster="us-central-00", namespace="loki-1", container="ingester"}
{cluster="us-central-00", container="ingester", namespace="loki-1"}
Rate Limiting. To simply put, the distrubter’s rate limit is based on the per tenant limit and the number of distributors. Distributors know how many their friends are out there by using ring config (e.g., gossip ring with memberlist). If tenant
Ahas rate limit of 10MB per second, and there are current 10 distributors, each distributor will have10MB/10 = 1 MBper second for tenantA.Hashing. Distributor hashes the tenant and the label set to generate a stream ID and find ingesters with hash ring (more about hash ring later).
Distributing. Finally! Distributors send the logs to appropriate ingesters using stream ID. However, sending requests to ingesters can fail. Everything fails. Fortunately, there is a config called replication factor, which means a quorum of writes must succeed. If the replication factor is
3, then2writes must not fail (floor(replication_factor / 2) + 1). If the request fails, the distributor will retry. When the ingesters successfully ingested logs into storage, distributor responses with success code.
As you can see, the distributor carries many works, and it also handles a large volume of requests, therefore lessening the burden of ingesters. Distributor is designed to be stateless so it can be scaled horizontally under different loads.
Ingester and WAL#
Distributor distributes logs. And, of course, ingester ingests logs into storage like S3.
Ingester buffer chunks in memory — until either time is up (chunk_idle_period or max_chunk_age) or chunk size has reached limit (chunk_target_size).
But we know any operations can fail. Distributors have done their job by sending logs to multiple ingesters and hope a quorum of them will succeed; otherwise, they will proceed to retry.
What about ingesters?
Ingester uses write ahead log (WAL) to make sure that data in memory won’t just vanish after a crash. That is, the ingester will save incoming data to the file system. After restarting, the ingester will replay all the events, then registers itself into the ring and begins its full-time job with other ingesters again.
When the ingester is “replaying” the events, WAL has a backpressure mechanism to restrict the memory usage. Ingester knows how much data is being replayed and checks the ingester.wal-replay-memory-ceiling threshold simultaneously. Once memory usage hits the ingester.wal-replay-memory-ceiling (default: 4GB), it flushes data to the storage (e.g. S3). 4GB is not a small number, so it’s better to check whether the default setting fits.
Ingester should be able to replay stably with the backpressure mechanism. However, there are still a few caveats:
- Ingester won’t be able to replay all the WAL if it’s corrupted or partially deleted. The data might be loss but won’t stop ingester from starting. You can check the metric
loki_ingester_wal_corruptions_totalfor such an event. - When the disk is full, the ingester can still write to the storage (e.g., S3), but will not log them into the local file system. Availability takes precedence over durability. You can use
loki_ingester_wal_disk_full_failures_totalto know this event happens. But really, you should always monitor your remaining disk space no matter what. Don’t let this kind of thing drags you down.
Read path: querier, query frontend, query scheduler, and … ingester (again)#
Read path is about reading logs, of course.
There are multiple components involved: querier, query frontend, query scheduler and once again, the ingester.
Querier#
Remember we talked about how Grafana Loki breaks a “big query” into smaller ones? queriers are responsible for executing them.
There are two sources for the querier to fetch logs:
- Ingesters, for in-memory data:
At write path, we learned that ingesters receive logs from distributors, buffer them in memory, then finally flush them into the storage. Querier first finds logs in all ingesters for their in-memory data. Because of the replication factor, there are probably multiple ingesters holding the same logs, the querier will deduplicate the logs with identical nanosecond timestamp, label set, and log content.
Regarding to live tailing, the querier will open gRPC streams to all ingesters and starts push logs to you and still supports filters and expressions, gives you the real-time insight.
- Backend storage (e.g. S3). Querier falls back to backend storage with the same query if nothing is found in the previous step.
Query frontend#
Query frontend is an optional, stateless component sitting in front of all queriers. It provides the same API endpoint as queriers. When query frontend is enabled, it holds an internal FIFO queue, and queriers will act as queue consumers.
Query frontend has several responsibilities:
Splitting, queueing, and putting results together. The query frontend breaks a “big query” into much smaller ones. These smaller queries are enqueued for queriers to consume parallelly and make sure subqueries can be retried once some of them failed (e.g., OOM). Finally, the query frontend receives the results from all queriers and assembles them.
Caching. Grafana Loki supports metric queries. Query frontend caches and reuses them later if applicable. Again, when results are not available, it enqueues the queries for downstream queriers to execute. Query frontend can leverage in-memory cache, Redis, and memcached for storage. On the other hand, the cache of log queries, seems to be under active development at the time of writing.
Query scheduler#
Query scheduler is also an optional component. Even though we just mentioned that query frontend has an internal message queue that can be used to split a huge query into smaller ones, it’s probably not the most ideal way to run in terms of scalability.
Each querier has a worker pool size controlled by setting -querier.max-concurrent. The internal workers connect to query frontends using round robin mechanism.
However, to ensure that each query frontend has at least some queriers connected, the queriers need to increase their worker pool size when the number of query frontends exceeds the capacity of the querier itself.
Say, we have 1 querier with -querier.max-concurrent set to 1 and 3 query frontends, the querier worker pool becomes 3 and connect to each of query frontend:
In this situation, the querier can suffer from overload, or even worse, OOM. If we don’t want this to happen, we have to limit the number of query frontends, but then this will also sacrifice its scalability.
And this is where query scheduler comes to rescue. Enabling query scheduler will move the internal queue in it, so query frontend and querier can scale independently.
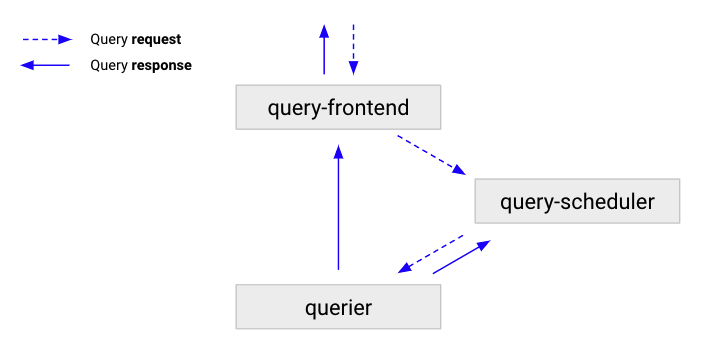 |
| source: Grafana Mimir query-scheduler (Same as Grafana Loki) |
The read path is far more high maintenance that the write path. If you want to go micro service mode, make sure you have reviewed the necessity of components above.
- Why query-frontend scalability is limited
- How query-scheduler solves query-frontend scalability limits
Other components#
Ruler#
Ruler is the component for continually evaluating rules and alerts when it exceeds the threshold. If you are familiar with Prometheus alerting rules, you understand it already.
Table manager#
Grafana Loki can store indicies and chunks in table-based storage and will create these tables depending on the schema and delete data once retension is expired.
However, you will have to set a lifecycle policy for chunks that stored in object stoage like S3:
The object storages - like Amazon S3 and Google Cloud Storage - supported by Loki to store chunks, are not managed by the Table Manager, and a custom bucket policy should be set to delete old data.
But the indicies on S3 (via boltdb-shipper) can be managed by table manager.
Compactor#
This is an optional component where it can handle data retention just like table manager, and when you use compactor to manage data retention, you won’t need table manager.
Another important functionality of compactor is…, yes, it compacts the indicies.
An ingester writes an index every 15 minutes, which results in 96 indicies per day. Since it’s very unlikely that you only have one ingester on production environment, there can be hundres of indicies in a single day.
Compacting these duplicate indicis not only saves costs (probably not much), but also lower the overall query latency.
Into the ring#
Grafana Loki uses consistent hash rings to achieve availability, scalability, and log sharding. Hash rings connect instances differently depending on the deployment modes. In micro service mode, there are several rings among different components. The information of rings are stored in a key-value store which defauls to memberlist. Other options like etcd, consul or inmemory are available.
memberlist uses gossip protocol to sync information of all nodes of the same component type. There are two particular rings I’d like to share:
Distributor ring: Remember how rate limit is calculated with the number of distributors? Distributors meet their friends using their very own distributor ring.
Ingester ring: Ingester ring is also used by distributors since the latter needs to know where to sendother As, a combination of tenant and label set will be hashed to a stream ID. A stream ID will be used to determine the keyspace of the ring, and the correspondent ingester will be found. If the replication factor is
2, there will befloor(2 / 2) + 1 = 2ingesters receive logs. Take the following image from Getting started with logging and Grafana Loki as an example, ingester03and04(the next ingester, clockwise in the ring) will both receive data of the given stream from the distributor.
 |
| source: Getting started with logging and Grafana Loki |
Check the Consistent Hash Rings document for other rings.