2022/03/29 update:
In terms of bandwidth, there are actually two metrics called NetworkBandwidthInAllowanceExceeded and NetworkBandwidthOutAllowanceExceeded for ElastiCache like EC2.
They are better metrics to determine whether a node has already reached bandwidth limit. If these values are not yet available or not increasing, it means the node probably either hasn’t exceeded burst bandwidth or burst time.
The Incident#
Recently, we saw unexpectedly high traffic during a special event (well, the traffic itself was expected, just didn’t expect this much), and then service went down for a few minutes. The application didn’t show high CPU utilization or memory usage, but API latency was climbing. Checked upstream services, looked all good.
The service team checked the application’s logs and noticed there were many errors related to Redis.
Then checked the Redis’ metrics, CPU is low, memory usage is high, swap is slowly increasing, that looked not good, but shouldn’t cause connection problems. Redis latency is slightly unstable; however, it’s only a few microseconds higher.
What gives?
It turned out to be a bandwidth issue. Actually, this wasn’t the first time we faced this issue. Other services had vertically upgraded their Redis node types beforehand. The service we are talking about here hadn’t. The node type they were using was more than adequate in “normal” days but not capable of traffic like this.
How to Determine If an Instance Has Reached Its Bandwidth Limit?#
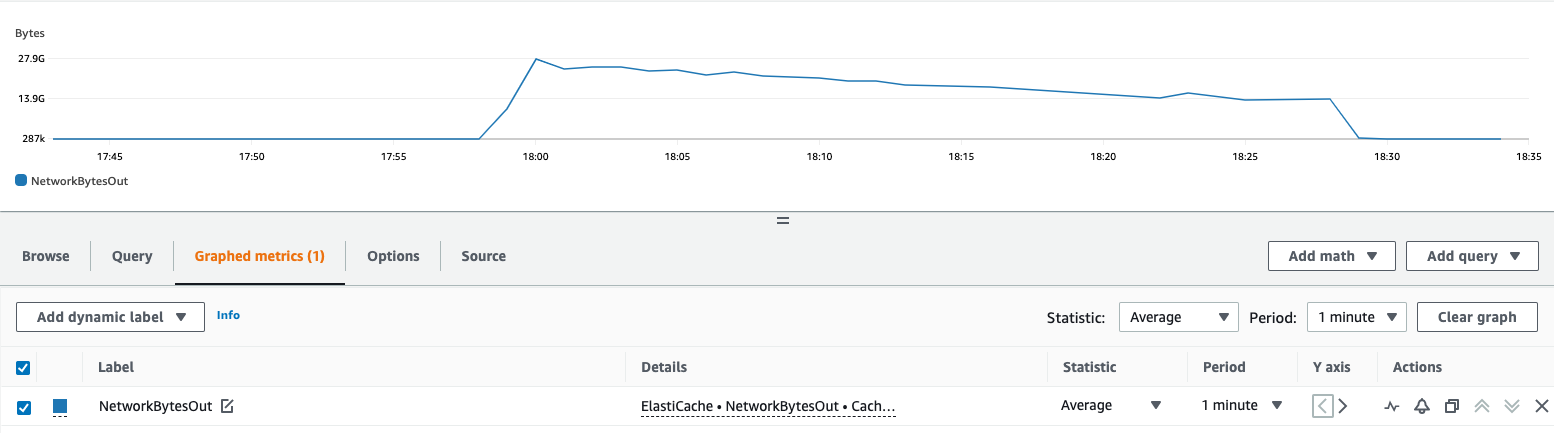
m5.4xlarge Redis replica. Which reached 27.9GB at a particular minute. How do we know whether it is safe in terms of bandwidth?
You might say, that’s easy. Just go to the pricing page to see the spec!
Unfortunately, you just can’t.
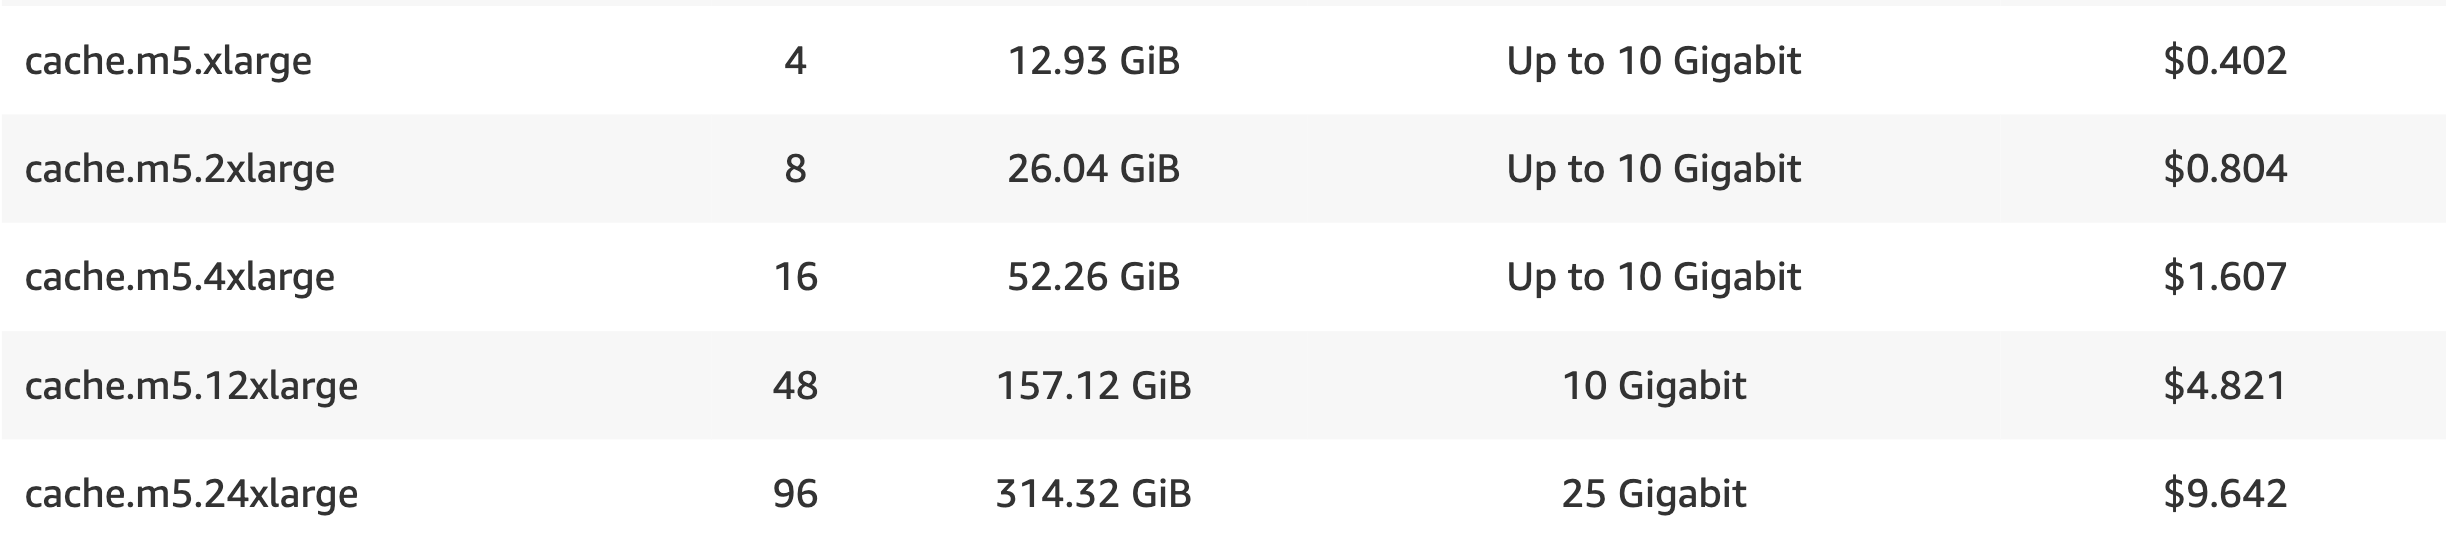
Instead, let’s head to Amazon EC2 instance network bandwidth and check the instance type we are using. Since m5.4xlarge is a General purpose instance, let’s find its data.
Even though this page is dedicated to EC2 instead of Elasticache, this is still the closest data we can use at this point.
Scroll down a bit, and you will find:
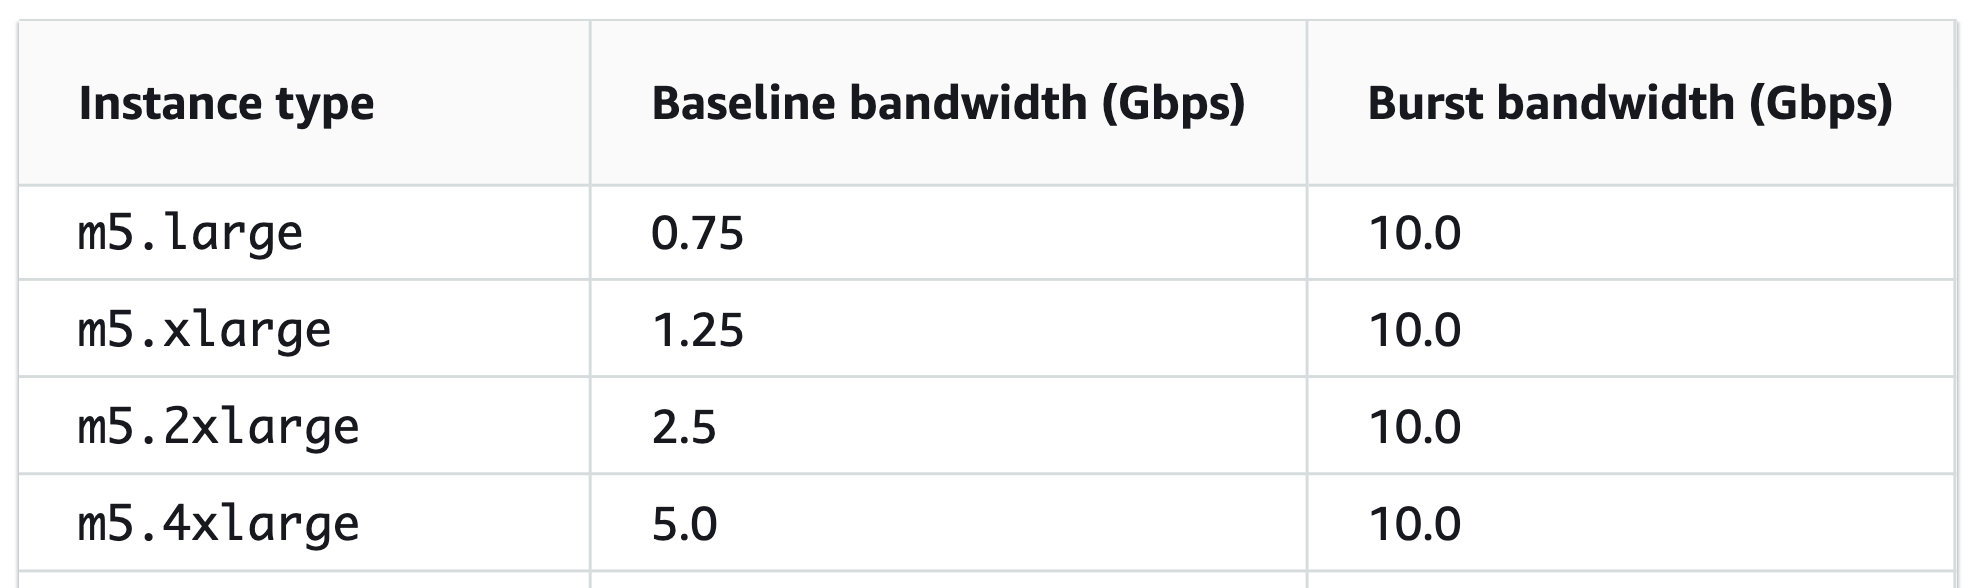
As the table shows, the baseline is 5Gbps and the burst bandwidth is 10Gbps for an m5.4xlarge instance.
It’s worth mentioning the bandwidth listed in the table above stands for the aggregation of inbound and outbound traffic, and across all ENIs according to AWS support engineer.
So, it’s better to take NetworkBytesIn into account as well.
However, since we only have NetworkBytesOut here (due to the laziness of mine), let’s just use it to do some simple math:
The peak NetworkBytesOut is 27.9GB (GB as in 10^9; not GiB, as in 2^30) per minute.
27.9GBper minute is0.465GBper second in average.0.465GBper second is3.72Gbps.- So roughly
74.4%of baseline bandwidth, it’s safe in this regard.
The Problem with “Average”#
We can only know the “average bandwidth per second” at this minute. It doesn’t mean that the instance never reached limit during the entire minute. It could hit the limit in the first few seconds, then went below the threshold. This isn’t too bad; usually, the burst bandwidth can help you a while. But burst for how long? 5 ~ 60 minutes, depends on the instance type.
On the other hand, if the result shows that you have breached the limit for a period, something is definitely wrong.
Increasing Replicas Doesn’t (Necessarily) Save You#
What can we do when the bandwidth has officially become a problem?
- If the access pattern is mostly read, then the most simple and uninterrupted way to save the day is to increase the replica. After the replica is created, rolling the service so the reader endpoint’s DNS-based load balancing can weigh in.
- If you have a bunch of write requests, then you have to watch out for the Primary node’s bandwidth as well.
- Say, we initially have two replicas: Primary (let’s call it
A), another is the read replica. Let’s call itB. - When we saw there is a bandwidth pressure on
B(but not necessarily onA), so we added a read replica,C. - After
Ccame up, the read loading became evenly spread betweenBandC. But our primaryAis now responsible for replicating data toBandCinstead of onlyB.
- Say, we initially have two replicas: Primary (let’s call it
This case is about the node of an Elasticache for Redis with Cluster Mode disabled, which means there is only one shard. Besides using more read replicas (but potentially risking the primary), it’s also feasible to use a higher-level node type. The downside is you will either face unwanted downtime or have to create another bigger cluster then switch over.
If you’re using Cluster Mode enabled cluster, the solutions are almost the same, except you can create more shards to handle the write-heavy workload. It still costs a lot of time to complete the operation, though.
Conclusion#
Bandwidth is one of the metrics that are often neglected, like TLS certificate expiry or low disk space. It doesn’t cause problems all the time. But when it does, it usually costs way more time to locate than others.
If it’s an expected event, plan early, plan accordingly.